
Assignment 2:
Exploring
Quadratics in Vertex Form
by
Jenny Johnson
Quadratic functions are usually recognized in the standard form y = ax2 + bx + c. This is a quadratic equation when y = 0, so when 0 = ax2 + bx + c. The purpose of this exploration is to examine the graphs of quadratic functions when they are in the form y = (x – d)2 + f. The graphs of quadratic functions in both of these forms are in the shape of a parabola.
What happens to the parabola
as d varies in the function y = (x – d)2 + f ?
If we keep f = 1, we can
explore the effects that d has on the parabola. First, what happens when d = 1?
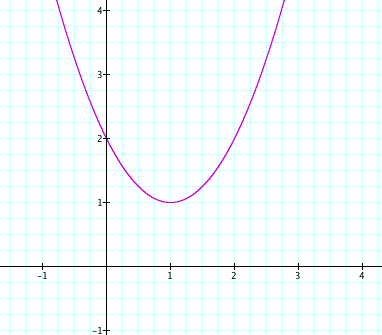
The parabola is concave up
with a vertex of (1, 1).
The
following illustration includes six different graphs with d values ranging from
-1 to 4.
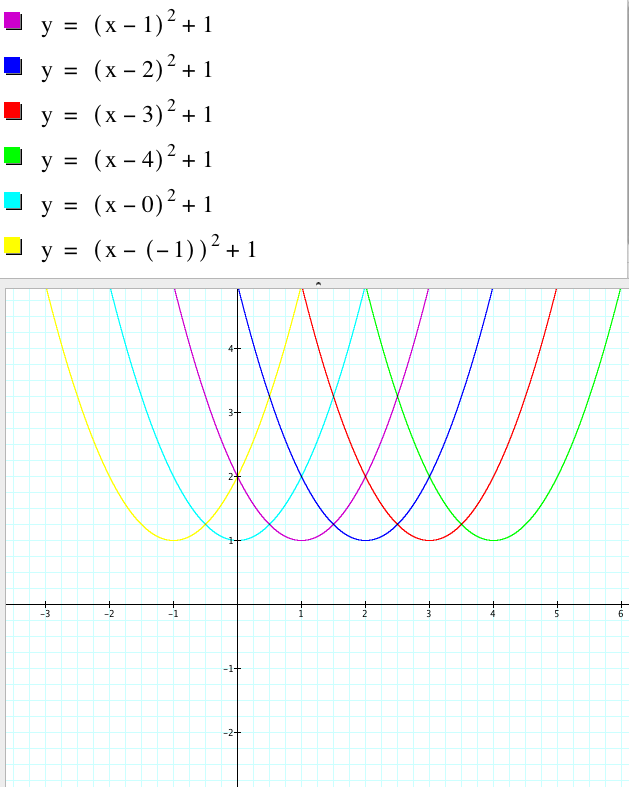
As the parabolas show, when d = -1, the vertex is
(-1, 1). When d = 0, the vertex of
the parabola is (0, 1). When d =
1, the vertex of the parabola is (1, 1).
When d = 2, the vertex of the parabola is (2, 1). When d = 3, the vertex of the parabola
is (3, 1). When d = 4, the vertex
of the parabola is (4, 1).
Clearly, d is always the x-value of the vertex of the parabola. Varying d does not change the shape of
the graph, only the position with respect to the x-axis. The following movie shows the parabola
as d ranges from -5 to 5.
What happens to the parabola
as f varies in the function y = (x – d)2 + f ?
If we could d constant at d
= 1, we can explore the effects f has on the graph. The following illustration includes the parabolas as f
ranges from -1 to 4.
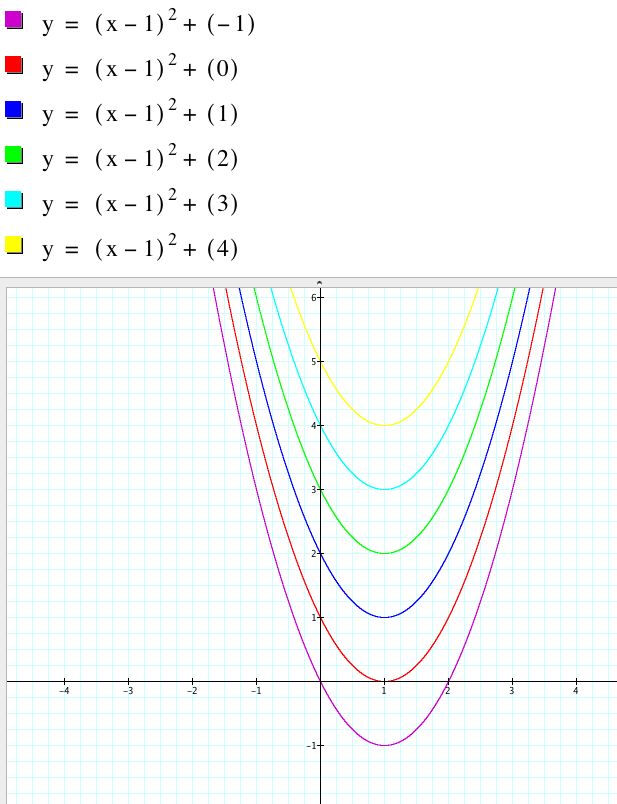
As the parabolas show, when f = -1, the vertex is
(1, -1). When f = 0, the vertex of
the parabola is (1, 0). When f =
1, the vertex of the parabola is (1, 1).
When f = 2, the vertex of the parabola is (1, 2). When f = 3, the vertex of the parabola
is (1, 3). When f = 4, the vertex
of the parabola is (1, 4).
Clearly, f is always the y-value of the vertex of the parabola. Varying f does not change the shape of
the graph, only the position with respect to the y-axis. The following movie shows the parabola
as f ranges from -5 to 5.
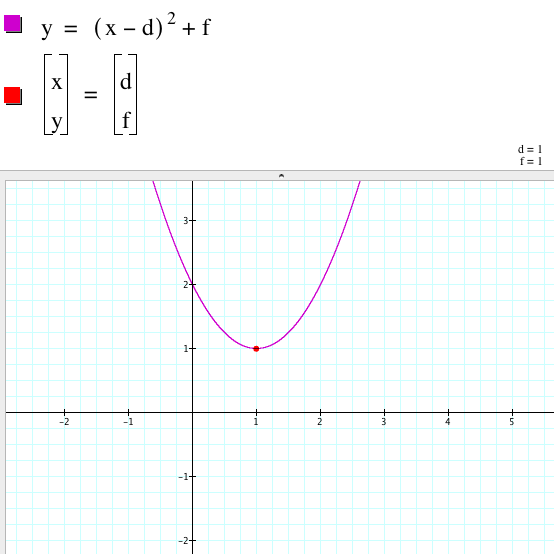
We can conclude from our explorations that when the
quadratic is in the form y = (x – d)2 + f, the vertex of the parabola will be
(d, f). To illustrate this
concept, we can plot the points (d, f) on our graphs using a parametric equations
for a point, as is shown in the picture below (when d = 1 and f = 1).
The
following movie shows the point (d, f) and the parabola as d ranges from -5 to
5.
As we see in the movie, the point (d, f) is always
the vertex of the parabola.
Similarly, we can view a movie that shows the point (d, f) and the
parabola as f ranges from -5 to 5.
We
also see in this movie that the point (d, f) is always the vertex of the
parabola.